Getting Started with Virtual Agent Mgmt

After sign up you will receive login credentials for accessing the Admin Console for Rezolve.ai.
From this console you can do the following:
· View Summary on the Dashboard
· Categorize and Organize the knowledge base
· Manage Q&A – Add and modify simple dialogues (Question & Answer)
· Manage SmallTalk – Add and modify common phrases and relevant responses
· Manage Task - Add known questions or phrases for which Complex Dialogue was created
· Mange Training Failed utterances - Train the bot on questions it failed to answer
· Review Chats
· Run Reports
· Add/Edit Users
Overview of Landing page - ‘The Dashboard’
On the Dashboard, you can find some basic information on the bot performance
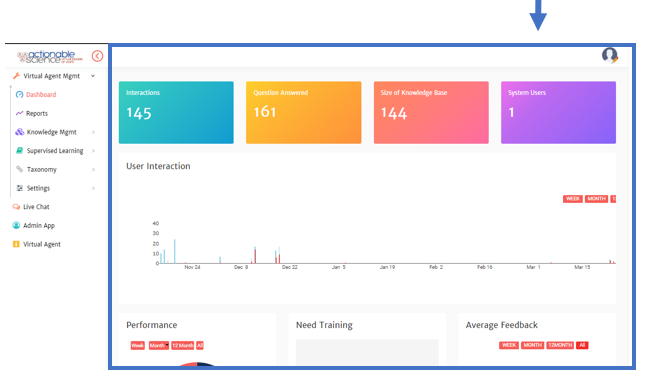
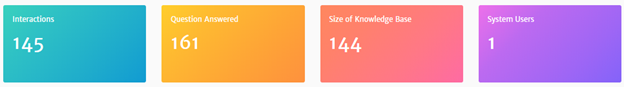
The top section of the four boxes covers:
· Interactions - gives you an overview of the number of chats with the bot
· Question Answered - questions the bot answered
· Size of Knowledge Base - how many dialogues the bot is trained on
· System Users - number of users who have accounts to access the bot in the portal
In the next section, the table looks at the number of chats and how many questions the bot has been asked by date. We differentiate the two since in one chat a user can ask multiple questions.
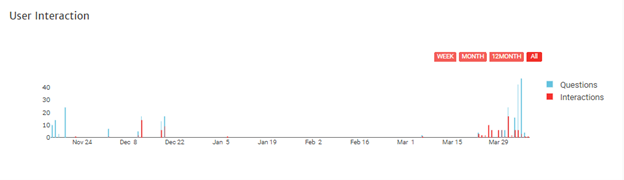
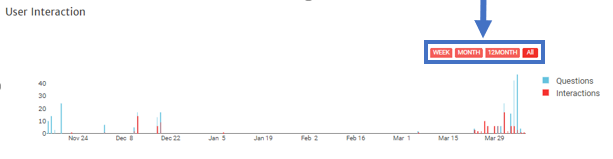
You can filter the view by:
· Week
· Month
· 12 Month
· All
Simply click on the filter you would like to apply.
In the next section, a pie graph and multiple tables.
The Performance pie graph shows you how many chats the user said the answer was helpful or not helpful by date.
The Need Training bar graph looks at the questions that the bot was unable to answer that it hasn’t been trained on yet by date.
The Average Feedback bar graph looks at the feedback rating. At the end of a chat, the user may submit overall feedback with a star rating and comments. This graph looks at the star rating by date.
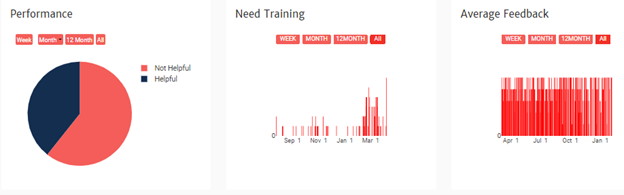
You can filter the view of each by:
· Week
· Month
· 12 Month
· All
Simply click on the filter you would like to apply.

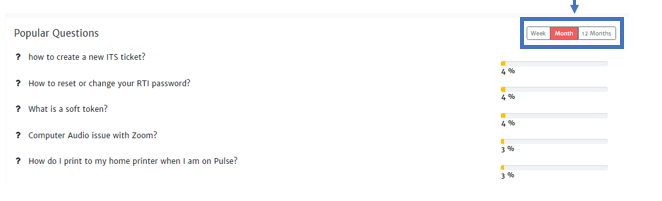
The final section looks at the top 5 questions asked to the bot.

You can filter the view of each by:
· Week
· Month
· 12 Month
· All
Simply click on the filter you would like to apply.

Rezolve.ai is an enterprise Agentic AI solution that deploys specialist AI agents for IT and shared services to reduce cost, accelerate resolution, and elevate employee experience.