

In my first article in this series, What ITIL Can and Cannot Do, I discussed the ITIL® framework (ITIL® is a registered trademark of Axelos, Limited. All rights reserved), some of the misperceptions about it, and how it can assist organizations to produce good ITSM results if it is adopted and adapted. This article takes a wider approach than the first, examining the broader ITSM journey.
ITSM, that is, Information Technology Service Management, simply refers to the management of IT services. In one way or another, every organization manages its information technology and the services it provides. ITSM is not a framework and has no “official” publications. Bear in mind that talking about ITSM does not necessarily mean we are talking about ITIL – from What ITIL Can and Cannot Do
In the first article, I quoted some of the questions ITIL (specifically ITIL 4) lays out to help organizations improve, and three of those questions can help us assess our current status and the next steps we should take for ITSM success.
- Where are we now?
- Where do we want to be?
- How do we get there?
To set the stage, we need to talk about the dangers of thinking that ITSM is a “one size fits all” concept. Among all the factors that affect how to apply the principles and practices of ITSM (in any of its variations) in any given organization, three should be top of mind:
- How critical is our IT capability to our business operations?
- How big is the organization?
- Given our answers to the first two questions, what is important for us to do first, and what is next?
In nearly every business, IT is critical in the 2020s, so it’s a matter of degree and appetite for spending, change, and risk. I’ve already said, “…every organization manages its information technology and the services it provides,” but how do we start to build a plan?
IT Service Management Differs from IT Management
IT management is all about the systems we use and the connectivity between them. IT service management, as the name suggests, is all about the services those systems deliver to customers and users.
So, let’s start by answering a basic question: What is a service?
“It’s…a question that Paul Wilkinson, an advocate of effective organizational learning and development, asks in his presentations as he travels the world. As to the response he usually gets – he’s lucky if 2-3 people out of an audience of 100 put their hands up to show that they know what a service is” – Joe the IT Guy
Back in the first article, I said that the common language ITIL provides may be its greatest contribution. Here, even though we’re not talking about any specific framework, ITIL can help us with a definition.
Service: A means of enabling value co-creation by facilitating outcomes that customers want to achieve, without the customer having to manage specific costs and risks. – ITIL 4 Foundation Glossary
The operative words here are about managing “specific costs and risks.” Let’s take an example from the non-IT world. If I take my car to the local garage for service, I don’t have to concern myself with renting the building, obtaining the tools required, hiring qualified mechanics, or getting a certificate of liability insurance; all those things are bundled into the cost of the service that I pay before leaving the premises.
On the other hand, in addition to handling all the above-mentioned particulars, the garage owner needs to manage the availability of services, the capacity of the garage to provide them, and the expectations and experiences of the customers who are consumers of the services. The outcomes customers want to achieve are better operational quality, longevity, and safety of their vehicles. The garage owner/operator will often hire a service manager, i.e., a person responsible for the management of the services, though often not the business itself or its equipment. ITSM and its people fill this role with regard to IT.
The Value of Maturity Models
When an organization embarks on an ITSM journey, there must be an understanding of where they are now, and they must have a basic set of goals and milestones they want to achieve. A general roadmap for the journey is often one or another of the various maturity models available.
Maturity models are simplified representations of an organization's ability to continuously improve in a specific discipline - Chisel Glossary
Note that what contributes to the organization’s “maturity” in this view is its ability to continuously improve, not how many services they provide, how many people are employed in IT, and not the length of time they have been doing service management.
Continuous improvement is at the heart of the ITSM journey
Many maturity models are based on ISACA’s CMMI®, Capability Maturity Model Integration.

These characteristics remain the same no matter the size of the organization. Even a single-person business can move through these steps as they do more to systematize and document their processes and procedures and work toward continuous improvement.
A different way of looking at ITSM maturity is shown in this Service Excellence Maturity Model from Ron von Haasteren, which measures maturity as a function of IT/business partnership.

Source: The Making of a Maturity Model
Please note that neither of these models precludes the other; in fact, the CMMI model, focused on improvement, can be used with almost any other model or framework. This emphasizes once more that ITSM, including its constituent components and methods, is not a one-size-fits-all approach. Adopt a framework, a methodology, and/or a model, and then adapt it to fit your organization’s needs and desires.
Because it is more focused on IT and ITSM, the Service Excellence model may be just the ticket for getting your IT organization more aligned and focused on its relationship with other lines of business while the CMMI model may help you understand the various stages of your improvement journey.
Moving Up Through Service Excellence
Without deciding and documenting what we are trying to achieve, we cannot decide where to start or how to measure our progress. Put in terms of the ITIL guiding principles, we can’t follow the first guiding principle, “Focus on value,” unless we understand what is valuable to our customers and stakeholders, and we can’t follow the second principle, “Start where you are,” if we don’t have a clear picture of the current status of our operations and the processes and practices that govern them.
Maturity models are here to help us get that picture and understand where we are as we move along our journey. Without deciding and documenting what we are trying to achieve, we cannot decide where to start or how to measure our progress. (We’ll explore some of the specific measures that can help us understand our maturity level in the section on metrics below.)
To further illustrate the necessity to adopt and adapt, it’s worthwhile to note that there are distinct differences between how companies whose business it is to provide IT services—usually called managed service providers, or MSPs—and companies or organizations with internal IT departments approach these questions. This bears a brief explanation. MSPs are, in this context, all about providing IT services to client or customer organizations.
In some ways, this makes it far easier for them to see the value of adopting an ITSM framework, especially ITIL, which was originally developed to document good practices for IT as a service provider, and which has been so widely used in the IT world. Bear in mind that, for MSPs, the maturity levels in any model take on different meanings and significance.
The Value of ITSM is Difficult to Explain and Show
Both defining and demonstrating the value of ITSM in non-MSP organizations has been a bit of a conundrum since that value is not directly provided; in other words, IT might contribute to the value of various business operations by making them faster and more cost-effective, for example, but the so-called value add is difficult to quantify and sometimes hard to understand. CIOs have struggled for years with explaining and demonstrating the value IT brings to the organization when they meet with their peers from across the enterprise.
Most often, we can clearly see the value of IT only by subtracting information technology and asking questions like, “What if we didn’t have computers on our desks and stable networks to connect them? What if we didn’t have collaboration software?” Then we begin to see the monumental advantages provided by IT in all its aspects. Communication, record keeping, sales presentations, engineering, the storage and protection of digital assets—there is scarcely anything that modern information technology does not facilitate and accelerate, saving huge amounts of the most precious resource any organization has: time. Time, as we well know, is money.
Here is where we should note that Level 1 of the Service Excellence Maturity Model is “Cost-center.” Many of the areas of focus for IT have for years been cost control and cost saving.
The majority (58%) of LoB (Line of Business) employees think IT leaders are spending more of their time keeping the lights on rather than supporting innovation. Furthermore, 44% go as far as to say they think their organization’s IT department is a blocker on innovation - Global CIO Forum
Most of the IT staff time (estimates range from 50 to 80%) is spent on “keeping the lights on” (KTLO) activities, making sure that services are available and stable, with enough capacity to meet the organization’s needs at a given time. This is extremely important work and should not be trivialized. In fact, the vocabulary that ITIL helped standardize defines an unplanned interruption of any service as an incident. There is currently some reevaluation of the real value of this type of work, but it is generally not considered a value-add.
CIOs would love to reduce the expenditures connected to KTLO work, and one way to do that is to reduce the number of incidents, which in turn reduces the time required—and therefore the expenditures—for support staff to perform all the tasks associated with incident management.

HDI: The State of Technical Support in 2023
But cost saving is not by itself a viable strategy, nor does it make an explicit difference in the organization’s maturity level. How, in real business terms, does efficient and effective IT deliver value to the company’s customers? That’s been a very difficult question for IT leaders to answer, and one that ITIL 4 can help answer, as we will see later.
I mentioned earlier the difference between MSPs and internal IT, and looking at the issue of KTLO work brings us to one of the reasons organizations outsource some of their IT functions to MSPs. Contracting with an MSP can release internal IT staff from some KTLO work, allowing focus on the more strategic, collaborative, and innovative aspects of IT, moving toward a higher level in the Service Excellence Maturity Model as a result. Although the maintenance of data centers has been reduced somewhat by the widespread migration to cloud services, maintaining and securing networks, providing first-level IT support, and provisioning computer hardware have all been targeted for outsourcing to reduce the time and money drain on IT budgets and allow for the higher-level focus.

HDI: The State of Technical Support in 2023
As for the factors contributing to the decision to outsource IT services, 52% of the respondent organizations in HDI’s survey stated that cost was a factor, but 15% noted that the “outsourced service isn’t a core business competency.” Put another way, the service being outsourced was not contributing value to the organization in a measurable, meaningful way.
What Does this Have to Do with ITSM?
The first guiding principle stated in ITIL 4 is: Focus on value. As Stuart Rance, a lead architect and lead examiner for ITIL 4, says:
“Value is not just financial. This guiding principle also encourages you to think about customer experience (CX) and user experience (UX). Of course, you can only do this if you first spend a bit of time thinking about who is using your service, and how it creates value for them.”
This bears expanding and examination. Value, according to ITIL 4, is co-created with customers and other stakeholders. As Warren Buffett says, “Price is what you pay; value is what you get.” To produce—and show—value to a business or other organization, IT must provide much more than just keeping the lights on. In the digital era, business operations, research and development, production, sales, delivery logistics, and finance—in short, every aspect of the organization depends on information technology to some degree.
Hence the desire to move toward the Business Partner level in the Service Excellence Maturity Model. But we won’t know how far or how fast we are moving without the right metrics and measures.
How Can We Measure the Value IT Provides?
“CIOs are finding out what value actually means, they’re tracking it consistently and they’re directly linking back to improvements, to the various initiatives and tasks, and they’re saying, ‘Here are the numbers to prove it,’” says Info-Tech Research Group principal research director Ross Armstrong.
Here are the ways Armstrong suggests to ensure IT can demonstrate its value:
- Ensure business-IT alignment: IT understands what value means to business colleagues
- Deliver business outcomes, not IT projects: identify and articulate how technology supports a business objective
- Identify IT metrics that demonstrate business success: have the numbers that tell the story
- Share the story of IT’s impact: share the details in a business context
IT has always been good at measuring quantitative operational metrics such as:
- The number of tickets generated (Ticket Volume) for incidents and service requests
- The time service desk analysts spent handling those tickets (Average Handle Time)
- The time to respond, repair, and resolve issues (Mean Time to Respond/Repair/Resolve)
- The levels at which tickets are being resolved (First Level Resolution), the number of tickets escalated to other levels, and so on.
The service desk can answer almost any question about how many tickets were auto-generated, created by end-users in a service portal, or received by phone, chat, email, or any other channel. The service desk has also been quite good at tracking customer satisfaction (CSAT) (which is more accurately end-user satisfaction when used by internal IT departments) and/or related metrics such as Customer Effort Score (CES) and Net Promoter® Score (NPS®) The service desk is most often the only part of IT that measures this; rarely are end-users asked to rate network performance or application availability, for example. (Net Promoter® and NPS® are registered trademarks of Bain & Company, Inc.NICE Systems, Inc., and Fred Reichheld.)
While all these metrics are necessary to understand the staffing needs and the basic performance of IT support tasks, none of them point to how IT and business operations are aligned, what business outcomes are improved or enabled, or how IT has contributed to business success. They are all based on the need to “keep the lights on,” and the reports produced from them can be summarized as “We kept the lights on.”
Measuring the Success of ITSM Frameworks
As explained in the previous article, “ITIL is not different from any other framework; it only provides guidance to help us decide what to do but does not prescribe how we should do it and certainly does not do it for us. It is not a so-called ‘silver bullet’ capable of producing rapid and productive change. We must adapt its guidance and do the work required to produce the desired outcomes.”
Put more succinctly, succeeding with ITIL and/or ITSM and moving up the maturity scale—no matter which model you use—means there’s work to do. IT is going to absorb more work than it currently has, all without allowing the lights to go off, and while enabling business success. In the business parlance of today, “That’s a big ask.”
We’ve already established that IT needs to tie its expenditures to business outcomes, so how can we measure the success of our service management investments in terms of business outcomes?
The most recent HDI service management report, The State of Service Management in 2022 (the 2023 survey is underway as of this writing), lists the ways organizations say they measure the value of service management.

HDI: The State of Service Management in 2022 (Percentage of organizations)
Of primary interest to this discussion are the top three items listed:
- 55% of respondent organizations said they see an increase in customer satisfaction
- 44% said a decrease in incident volume shows service management value
- 35% said they see an increase in incidents resolved without business impact
All of the top three can be tied to our discussion of value. Earlier, I said (quoting Ross Armstrong), “Identify IT metrics that demonstrate business success: have the numbers that tell the story.” What stories can these numbers tell?
Whether customer satisfaction has increased because the company’s external customers are being better served—as in the case of MSPs—or whether the respondents are companies with “internal customers” (end-users and lines of business), the survey results indicate that these organizations believe that their ITSM efforts are not only producing better results for their customers but that the improvements are being recognized by those customers, who in turn are giving higher ratings.
A decrease in incident volume, i.e., the number of unplanned interruptions in services, shows clearly that service management is helping organizations reduce the time and effort spent on KTLO tasks, or firefighting.
Most notable, however, is that fully one-third (35%) of respondent organizations recognize that, although malfunctions of one sort or another are inevitable, being able to resolve them without business impact is key. Whether the impact has been mitigated by automation, self-healing systems, or rapid and correct categorization, prioritization, and response, these organizations recognize the positive results of service management practices.
This is the story that is likely to garner the most attention from senior business leadership. They understand that there can be technical malfunctions and that mistakes are made, but their understanding and patience wear thin when there is a negative impact on the ability to conduct business. If IT becomes business-focused to the point where business impacts resulting from IT incidents can be reduced or even eliminated, IT has demonstrated itself to be a better partner to the lines of business and an active participant in moving the whole organization forward.
The ITIL 4 guiding principles offer some insight into how and why the reduction of business impact can and should be accomplished. Guiding principle 5 says Think and work holistically; in other words, think about the end-to-end consequences—not only of interruptions but of any actions or errors that have potential impacts on the business environment. Guiding principle 7 suggests that we Optimize and automate. Automating actions in response to actual or potential interruptions can mitigate or alleviate business impacts.
Generative AI-powered ITSM engines like Rezolve.ai can handle such automated actions with ease. For instance, Rezolve.ai integrates within MS Teams, auto-resolves most of the tickets, and orchestrates IT processes like password resets and automatic software installations. It also learns from past tickets and uploaded documents to ‘learn’ and improve every IT support request.
Metrics for ITSM Success
Remember that measurement and reporting are necessary management practices no matter what framework is adopted for ITSM. Because the service desk is the most customer/end-user-facing of the many areas of IT, many of the metrics IT organizations track revolve around the service desk. We have already catalogued some of them, including:
- Ticket Volume
- Average Handle Time (AHT)
- Mean Time to Respond/Repair/Resolve (MTTR)
- First Level Resolution (FLR)
- Tickets escalated
- Tickets miscategorized
- Ticket backlog / Number of active tickets
- Percentage resolved within Service Level Agreement (SLA)
- Tickets that could be resolved through self-service (Level 0 Solvable, or LZS)
- Cost per Ticket
- Incidents by type
- Incidents associated with known problems
- Incidents without a known resolution
- Customer (or end-user) satisfaction
Again, most of these are directly related to IT operations. If we begin to think more holistically, we can begin to draw some connections between these basic metrics and business value, mostly having to do with the consumption of time and, therefore, money.
We’ll look at this in more detail below.
Ticket Volume might be characterized as a kind of report card for IT, depending on the percentage of tickets that are for incidents versus service requests. A high percentage of incidents indicates device and/or system fragility. Tracking incidents by type can help identify devices, applications, or systems that are producing a high number of incidents, thereby producing disproportionate expenditure of time, effort, and money. Identifying the sources of high incident volumes can be of great assistance when planning improvements.
Cost per ticket is usually represented as fully burdened cost per ticket, determined by dividing the total service desk budget—including staff salaries, benefits, training, office costs, equipment, software licensing, and anything else related to handling tickets—by the total number of tickets. This can be calculated per week, month, quarter, or year, depending on an organization’s preferences. Note that this calculation only includes costs directly associated with ticket handling, not the associated costs of downtime or lost productivity. It does provide the IT department with information on cost and may figure strongly in decisions on outsourcing some or all the service desk function to an MSP.
Miscategorized tickets create trouble because they make it difficult to accurately report on the details of ticket-based work, especially on tickets by type.
Level 0 Solvable (LZS) tickets are those which can be resolved by the user if the resolution is properly documented and accessible to the user, i.e., there is a known fix that can be applied by a user with no extraordinary skills or elevated system access. Tracking LZS can help the organization understand why and how knowledge management and self-service can help unburden the service desk.
Incidents associated with known problems bear some explanation since we have yet to discuss the definition of a problem. The ITIL 4 glossary defines a problem as a cause, or potential cause, of one or more incidents. Tracking the association of incidents with problems can help understand the scope of the problem, the priority and urgency of either solving and eliminating the problem or providing a usable workaround. Known problems are documented as part of problem management.
Problem Management Practice: The practice of reducing the likelihood and impact of incidents by identifying actual and potential causes of incidents and managing workarounds and known errors – ITIL 4 Glossary
Like ITSM, Metrics are Not “One Size Fits All”
Different businesses track different metrics. While all the metrics mentioned here are more or less common, there are no mandates or lists of “must-have” metrics. ITIL does not prescribe what to do or how to do it; it describes good practices that have worked in successful organizations, and it is the most widely documented of all ITSM frameworks.
Your adoption or non-adoption of any metric should be determined by your answers to the questions, “How does this measurement help us align with the goals and outcomes our business wants and needs?” and “How does this measurement help us to understand and explain the value we provide?”
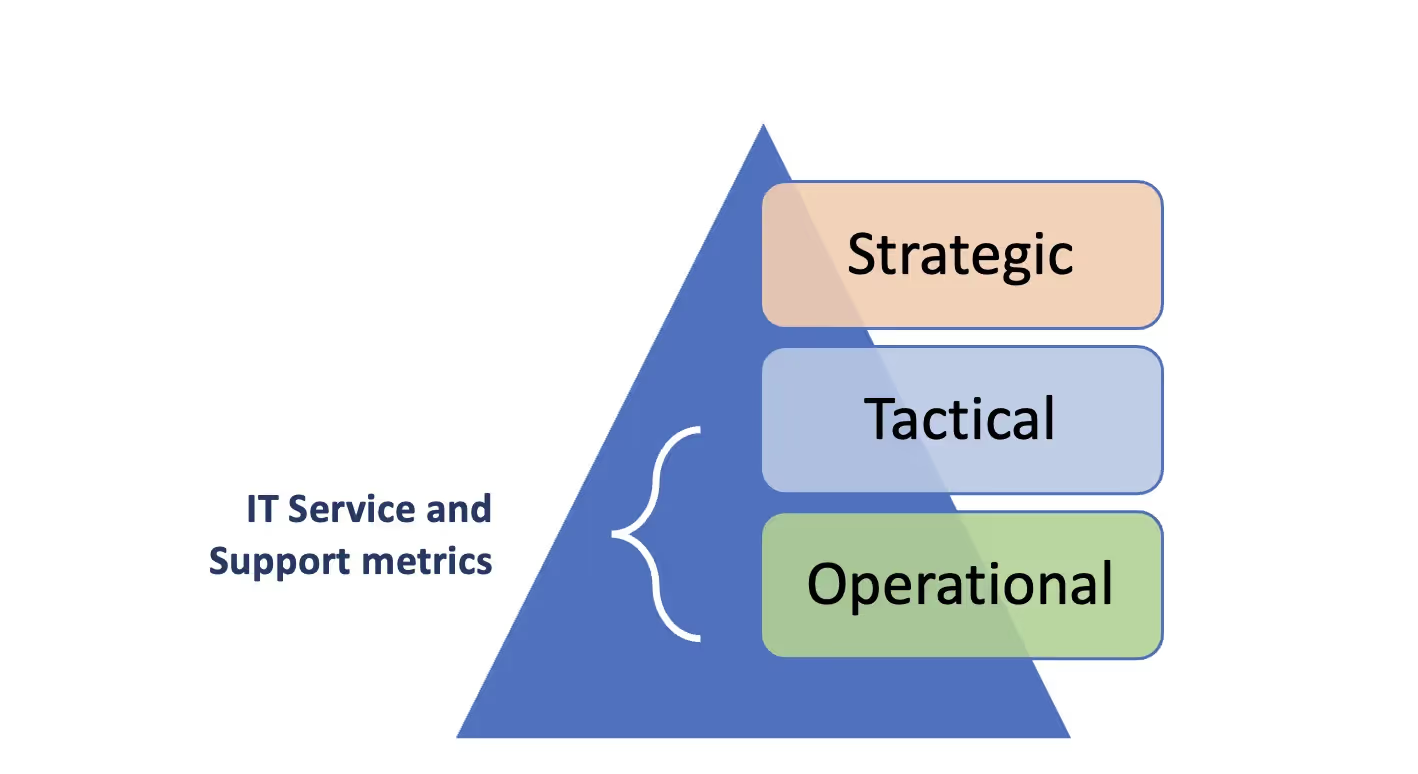
Three Levels of Metrics
Operational Metrics are necessary to accomplish and track the day-to-day workings of a department, in this case, IT and more particularly, the service delivery and support teams within IT. Average Handle Time and Ticket Volume, for example, are usually used to determine staffing levels, based on how many analysts/agents are needed to handle the volume of work. Operational metrics are often Key Performance Indicators (KPIs) that show how well operations are working.
Tactical Metrics are often aligned with Critical Success Factors (CSFs), which are necessary preconditions for the achievement of intended results, according to the ITIL glossary. Once the CSFs have been determined and defined by the organization, measuring and tracking progress against those factors is at the tactical level. Two examples of tactical metrics with reference to ITSM are:
- Availability – is the service there when it is needed? What percentage of the time?
- Capacity – are the systems handling the demand for them?
Strategic Metrics in this context measure progress toward the goals the senior management and/or board of directors have chosen, that is, general business goals such as increasing market share and profitability. Although the service and support functions of IT do not determine or track strategic metrics directly, it is essential that the Objectives and Key Results (OKRs) are understood, and that the operational metrics are properly aligned with them to produce desired business outcomes.
Metrics are mileposts. It’s important to remember that we need to know where we are so that we can adjust our plans to get where we are going.

While service desk and service management measurements are necessary for staff optimization, performance management, and cost tracking, they are of little interest at the strategic level. It is critical, however, that these operational metrics are aligned with the tactical and strategic levels, however. The measures taken at each level should reflect the goals of the organization.
Metrics and Maturity
Let’s take a look at some specifics about measurements and how they can help us assess our maturity. We’ve already stated that the CMMI model is about improvement. Let’s break down the levels in the Service Excellence Maturity Model and look at some of the metrics we can apply to track our journey.
Level 1: Cost-center
Nearly all the quantitative and operational metrics we’ve mentioned are associated with the firefighting/KTLO activities of Level 1. Operational metrics in general have an internal (IT) focus making them Maturity Level 1 measures.
- Ticket volumes and cost per ticket can give us a clear picture of operations but do not contribute to our movement to higher maturity.
- Mean time to Respond/Repair/Resolve can help us understand how we are performing internally, but not how we are providing value or becoming better business partners. This is firefighting/KTLO work.
- Ticket backlog is an internal performance record that may help us find inefficiencies and opportunities to improve operations.
- Incidents by type can help us focus operational efforts.
- Percentage resolved within the Service Level Agreement begins to bridge the gap to Level 2, since it implies that we have negotiated at least a minimum service level with our lines of business, and we are measuring our performance against that level. (We should note here that currently, there is a widespread movement for organizations to draft and adopt Experience Level Agreements (XLAs), but these do not replace SLAs and have yet to gain universal acceptance.
Level 2: Controlled Service Delivery
To fit the characteristics of Level 2, we need to be measuring how and where adopting our chosen ITSM framework(s) is making a difference.
- The miscategorized tickets metric helps us see how well the principles of service management are being applied in ongoing work, even at the so-called “front line.”
- Measuring Incidents associated with known problems assumes that we are practicing some form of problem management and tracking the problems we have identified.
- Number of procedures automated indicates that we are optimizing our service delivery mechanisms.
- Service availability may at first seem like a different way of measuring incidents, but it actually goes deeper. It implies that we have worked with our constituent lines of business to provide services when they are needed and that the services are reliable.
- Vendor/supplier management indicates that we are analyzing the criticality of service delivery and are working with third parties to ensure it.
Level 3: Customer-centric
For this discussion, it’s important to understand that we have both internal and external customers, although many in ITSM do not like or use the word customer for anyone who works for the same organization. Calling those who consume IT services customers here does not mean your organization needs to call them that; I’m using the term for the sake of simplicity and fit with the maturity model. The metrics that demonstrate and track customer-centricity are:
- CSAT (customer satisfaction) – How satisfied were you with this interaction?
- CES (customer effort score) – How difficult was it for you to get what you needed?
- NPS® (Net Promoter Score®) – Would you recommend us?
Please note that many in the world of IT and ITSM feel that NPS is not a good measure for internal IT, since employees generally do not have a choice; a recommendation is meaningless.
As mentioned with reference to SLAs and XLAs, there has been a movement in the past few years to place more emphasis on experience than on transactional satisfaction. This view takes much more into account than just interactions with the service desk and does a far better job of measuring the real impacts—positive and negative—IT in all its aspects has on the organization and its employees. IT end-user experience can help identify specific areas for improvement. (More on this topic)
Level 4: Business Alignment
Metrics and measures here are closely tied to business outcomes. These metrics are beyond the operational level and clearly have to do with business goals and objectives. Many of these use the COBIT framework from ISACA® as a reference. Again, combining frameworks or using them together can be part of an effective ITSM strategy. They are designed to ensure that IT strategy and enterprise strategy are aligned, and that IT is driving value for the organization.
- Percentage of stakeholder satisfaction with planned programs and services
- Level of business executive satisfaction with IT’s responsiveness (agility)
- Average time to turn strategic IT objectives into approved and agreed initiatives
- Level of stakeholder satisfaction with IT expertise and ideas
- Number of approved initiatives resulting from innovative IT ideas
Note: the word enterprise is used here to indicate “the entire organization and all its lines of business.” Even smaller organizations can measure IT alignment with business strategic objectives using these criteria. In general, however, the metrics would be used by larger organizations.
Level 5: Business Partner
Again, we can turn to COBIT for guidance on the right things to measure.
- Percentage of enterprise objectives addressed in IT strategy
- Percentage of self-funding initiatives in the IT strategy
- Level of enterprise stakeholder satisfaction with IT strategy
- Percentage of enterprise objectives attained because of IT initiatives
- Percentage of IT initiatives and/or projects championed by business executives or owners
As we can see, the higher levels of maturity in the Service Excellence model demand that we look outside the IT silo, communicate and collaborate consistently with business stakeholders, and deliver services that move the entire organization forward.
A Word About Metrics, Goals, and Goodhart’s Law
In any discussion of metrics and measures, it’s important to emphasize that the metric is not and should not become the goal. The mistaken practice of making goals out of metrics is very common in service organizations since their overall performance is often rated by their metrics, and often their funding is determined by their success in achieving specific numbers.
The problem with this approach is that it changes what we are measuring. For example, if we say, “The service desk’s funding will decrease unless the customer satisfaction rating is 90%,” the service desk is now measuring how close it is to 90% rather than how satisfied its customers are. This flaw in measurement is known as Goodhart’s Law, named after economist Charles Goodhart.
Goodhart’s Law: In simple terms, when a measure becomes a target, it ceases to be a good measure - Oxford Reference
To Summarize
All the metrics we track should be aimed at gaining and maintaining alignment with business goals and keeping the focus on value. While we need to keep the lights on and deliver services in the ways our business users need them, we need to continue finding ways to improve.
It’s also worth noting that metrics are not independent of each other. They form a fabric of interconnections and pulling on (emphasizing) one will affect others. For example, we may want to increase First Level Resolution and also self-service usage without realizing these may be closely connected. Increased self-service resolution by end-users will drive down the demand for the service desk, and, since the most likely resolutions from self-service will be the simplest, the resolutions provided by Level 1 will decrease. Bear the connections in mind during your analysis.
Of course, there are far more metrics you could be tracking and analyzing. With a little bit of work, you can create a way to measure almost anything and have a metric to answer almost any question you can ask. Remember, however, that just because you can doesn’t mean you should. Having too many metrics to consider can lead to “analysis paralysis” and stop or delay actions you need to take. Measure what matters, and that means what matters to you and your organization.
Continual Improvement
Through the gathering and analysis of the data from all your metrics, you now should know where you are—your starting point—and can begin to make plans to improve. Working with your business colleagues, plan your improvements and the ways in which you will gather feedback on each step. Remember that the ITIL 4 guiding principles that apply here are, “Progress iteratively with feedback,” and “Collaborate and promote visibility.”
Chances are there will be more opportunities for improvement than you can reasonably take on, so you now must choose wisely. This is the critical point for input from your business colleagues. They are the ones who will benefit from your improvements.
There are many ways to gather the feedback you need. Some of the ways we have seen IT departments interface with the lines of business are:
- “Lunch and Learns” - working lunches centered on getting information from colleagues and making them aware of your plans and limitations
- Focus groups – using prepared questions to elicit the pain points and barriers your business colleagues are experiencing and input on how to prioritize improvements
- Customer and/or employee experience data – what customers or employees feel is working well and what isn’t
It is quite likely that you will find that this feedback is helpful in deciding what to work on first, i.e., what’s most important to business productivity and all that flows from it. As a side effect, you will also begin to understand what value means to your business colleagues so that you can increase your focus on it.
Feedback of this type is not a one-and-done item to check off your list but should be an integral part of each iteration as you improve.
Remember the questions suggested in ITIL 4 now that you’ve taken action toward improvement:
- Did we get there?
- How do we keep the momentum going?
A Note About Technical Debt
Technical debt can be incurred almost anywhere in IT. The adage says, “If it ain’t broke, don’t fix it,” and often colleagues may suggest a workaround rather than a true improvement or replacement. There is certainly some wisdom in the adage, but there’s also a danger, especially in the fast-moving world of information technology. What “ain’t broke” today may not only break tomorrow but may get in the way of introducing new products or services, improving the ways your customers can do business with you, and so on.
Dependence on outdated or limited technologies may also expose the organization to cybersecurity risks. Every workaround introduces a new level of complexity, making it harder to monitor and protect. While spending on new products (more on that subject shortly) may be a harder sell to those who control the budget than a workaround, it is imperative to make the point that the expense will be deferred, not avoided.
Shiny Object Syndrome
The flip side of technical debt is the all too common desire for the latest technology, often called “Shiny Object Syndrome”, regardless of whether that technology fits the current plan, and whether it can produce value. Many times, we have seen senior business leaders fall prey to this syndrome and take IT departments along with them. The stereotypical scenario is that someone in the organization goes to a conference or visits a different company and sees something there they consider “cool” and attractive. They then become convinced that your organization needs this technology, and projects that are already in progress may be derailed or discontinued while money and time are expended to get the shiny new system up and running.
It may be difficult or even impossible to prevent this from happening, but the argument against shiny new things can be bolstered if you continue to follow the ITIL advice to focus on value and have a solid roadmap for updates, upgrades, and improvements. Every new product should be subjected to the same due diligence, as described earlier in this article.
Summary
Adopting service management frameworks can help your organization become more aligned, provided you do the work of careful planning and measurement as an enabler of continual improvement. If you are becoming more serious about your service management journey, now is the time to select which of your current metrics should serve as a baseline so that you can see improvement clearly as you progress.
As an example, you should see a decrease in the volume of incident tickets as more areas of your it services improve. If you use Level 0 Solvable as a guide for providing self-service, you should see self-service adoption increase as end-users recognize that the resolutions are available to them and that they work. The same is true across the board.
Once you start to see these improvements, find ways to tell the stories they represent. Gather the stories end-users and customers tell you and put them into your communications. Relate them to the value your business colleagues have discussed with you in the feedback they provide. Your improvements—and your value—will be visible.
Level Up Service Delivery with AI ITSM - Powered by Rezolve.ai. Book a Demo Now


.webp)
.png)


.webp)