

Article Sneak Peak
As IT infrastructures grow more hybrid and complex, keeping track of how systems and services interact is a major challenge. Visual Dependency Mapping, integrated into hybrid CMDBs, provides a powerful, real-time blueprint of relationships between applications, servers, services, and environments.
Here's why it matters;
- It gives dynamic, layered visualizations of infrastructure components and their dependencies.
- Helps accelerate incident response, streamline change management, and optimize cloud costs.
- Enables DevOps and SRE teams to maintain visibility, resilience, and documentation across fast-changing environments.
- Supports compliance, audits, and smarter planning with real-time updates and role-based views.
Visual maps evolve with your stack, ensuring better visibility, faster troubleshooting, and more confident decision-making. In the era of hybrid IT, they’re not just useful—they’re essential.
Introduction
In modern IT ecosystems, especially those built across hybrid environments, maintaining a clear understanding of how systems interrelate is a growing challenge. As organizations shift from monolithic architectures to distributed systems that blend on-premise infrastructure, public clouds, and SaaS platforms, the complexity of managing dependencies rises exponentially. This is where visual dependency mapping becomes essential. Integrated into hybrid Configuration Management Databases (CMDBs), visual mapping offers not only an intuitive way to interpret relationships but also enhances IT visibility, supports rapid troubleshooting, and drives more informed decision-making.
In this blog, we’ll explore what visual dependency mapping is, how it integrates with hybrid CMDBs, and why it’s crucial for improving observability, service management, and operational efficiency across modern IT environments.
What Is Visual Dependency Mapping?
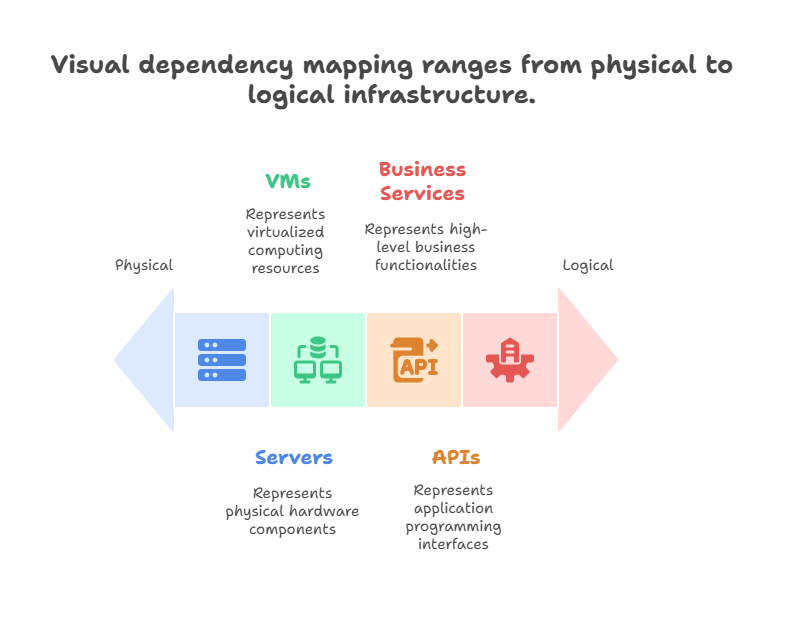
Visual dependency mapping typically consists of multiple layers that represent different dimensions of IT infrastructure. These layers may include physical infrastructure (servers, switches, data centers), virtual components (VMs, containers), application services (APIs, microservices), and logical groupings (business services, environments). Layered visualizations enable IT teams to quickly isolate relevant information, for example, by isolating the development environment, filtering applications with external-facing APIs, or visualizing only critical business services.
Visual dependency mapping is a technique that represents IT components, such as applications, services, databases, servers, and network devices, along with the relationships between them in a visual, typically graphical format. Rather than scrolling through text-based records, users can see a dynamic graph of how one system connects to others.
These visualizations are often generated automatically by scanning tools and discovery engines, and are layered on top of the CMDB to provide context. Each node in the map represents a configuration item (CI), and the links between them denote dependencies, such as "runs on," "connects to,"
Key Components of a Dependency Map:

- Nodes: Represent configuration items like applications, VMs, containers, and services.
- Edges (or Links): Show logical or physical relationships between the nodes.
- Layers or Views: Allow users to filter maps by service, environment (development, testing, or production), location, or time.
- Real-time updates: Reflect changes as they happen, ensuring the map stays accurate.
When implemented correctly, dependency maps can evolve with the IT environment and serve as living blueprints of digital infrastructure.
The Rise of Hybrid CMDBs
Traditional CMDBs were designed for static, centralized infrastructure. Today’s enterprises, however, operate in hybrid environments, a mix of on-premises systems, private clouds, public cloud platforms, and managed SaaS applications. Hybrid CMDBs are built to handle this diversity.
Characteristics of Hybrid CMDBs:
- Federated data architecture: Instead of storing everything in one place, they reference authoritative sources dynamically.
- API-driven integrations: Pull data from cloud-native platforms and orchestration tools like Terraform, ServiceNow, and other automation frameworks.
- Real-time sync: Data is continuously updated to reflect changes in cloud workloads and ephemeral services.
- Context-rich CIs: Each CI includes metadata from multiple systems, including tagging, ownership, compliance state, dependencies, and cost.
Dependency mapping becomes critical in hybrid CMDBs because relationships aren’t confined to a single stack or platform. Applications may rely on databases hosted on-premise, which in turn may authenticate users through a SaaS-based identity provider. Visual maps help make sense of this interwoven ecosystem.
How Visual Dependency Mapping Works in Practice?
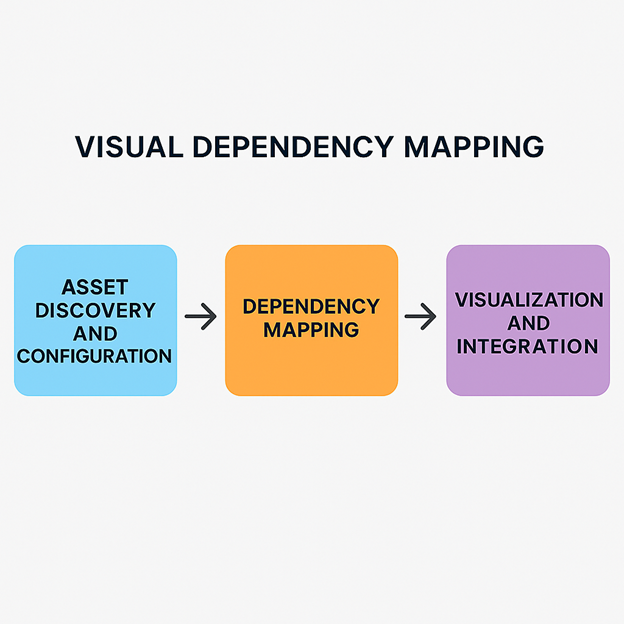
The whole process of visual dependency mapping typically begins with asset discovery or configuration ingestion, proceeds through relationship detection and dependency correlation, and culminates in real-time visualization and integration with monitoring, ticketing, or orchestration platforms. This end-to-end flow ensures that the CMDB accurately reflects both the infrastructure and its behavior in production environments, providing actionable intelligence rather than static inventory.
1. Automated Discovery and Ingestion
Visual dependency maps begin with data collection. Discovery engines scan network environments, APIs, cloud services, and system logs to identify assets and their connections. This data is ingested into the CMDB either directly or through integration pipelines.
Key technologies include:
- Agentless and agent-based discovery
- Cloud-native APIs and SDKs
- Infrastructure-as-code analyzers
Service mapping tools that build graphs based on network flow data, communication logs, and configuration files
2. Relationship Mapping and Contextualization
Once assets are identified, the system maps their relationships. This includes direct dependencies (e.g., a microservice calling a database) and indirect relationships (e.g., services sharing a load balancer).
In hybrid CMDBs, mapping engines must correlate data across:
- IP addresses
- DNS records
- Service endpoints
- Cloud resource IDs
- Deployment metadata
3. Visualization Engine
The visual component renders the dependency data into interactive graphs. Users can:
- Zoom in/out for detail or high-level overviews
- Highlight critical paths
- Filter by application, owner, or environment
- Trace impact paths from any node
- Export or embed maps for documentation or audit purposes
These maps become part of the CMDB UI or are accessed through dashboards embedded in ITSM platforms.
Benefits of Visual Dependency Mapping
The benefits of visual dependency mapping extend far beyond visibility alone. By illuminating the relationship between services and infrastructure, it dramatically enhances operational efficiency. IT teams can prevent disruptions by proactively identifying vulnerabilities or bottlenecks. Troubleshooting becomes faster as the root cause is traced visually across dependency paths. Resource allocation is improved through better insights into asset utilization, while change planning is enhanced with accurate impact analysis that accounts for downstream effects. These benefits not only boost productivity but also reduce costs and risk.
1. Enhanced IT Visibility
Visual maps eliminate guesswork. Teams can quickly answer:
- What will break if this server goes offline?
- Which systems does this application rely on?
- What assets does this service touch?
This level of visibility helps break down silos between infrastructure, security, networking, and application teams.
2. Accelerated Incident Response
During an outage, a visual map helps pinpoint the root cause faster. Instead of combing through logs or outdated spreadsheets, responders can trace the failure across dependencies to isolate affected systems.
Integration with monitoring and alerting tools means maps can also highlight affected paths in real-time.
3. Improved Change Management
Visual dependency maps enhance change risk assessments by clearly illustrating what is downstream from a planned change. This supports:
- Impact analysis
- Change approvals
- Automated risk scoring
By integrating with ITIL-based change workflows, maps enhance change processes, making them more intelligent and secure.
4. Stronger Compliance and Auditability
With complete, time-stamped visibility into service relationships, organizations can:
- Document control boundaries
- Validate access flows
- Track asset movement across regions
For regulated industries, visual maps enhance traceability and simplify the collection of evidence.
5. Better Cloud Cost Optimization
By visualizing dependencies and usage paths, organizations can identify:
- Redundant services
- Overlapping workloads
- Orphaned assets
Mapping usage to cost and business value supports smarter cloud spending decisions.
6. Support for DevOps and SRE Practices
Visual dependency mapping provides critical advantages for DevOps and SRE teams by enabling them to maintain visibility into complex, fast-moving environments.
- Improved deployment reliability: DevOps teams can visualize interdependencies before rolling out updates.
- Enhanced operational resilience: SREs use maps to identify potential failure domains and reduce incident impact.
- Accurate documentation: Maps maintain a living record of service architecture, useful for audits and onboarding.
These features support the continuous improvement and agility goals central to DevOps and SRE practices, improving service quality and operational coordination.
Best Practices for Implementing Visual Dependency Mapping
Good dependency mapping relies on several foundational qualities. Scalability ensures that the maps remain useful as the environment grows, handling thousands of nodes without performance degradation. Multilayered architecture allows for contextual filtering based on teams or use cases. Integrity ensures that relationships are valid, up-to-date, and tied to accurate CIs.
Maps must be continuously refreshed and validated through reconciliation workflows and real-time event streams to ensure accuracy. Without these core attributes, visualizations become cluttered or misleading.
A top-down approach is often the most effective strategy, where high-level business services are defined first, and infrastructure elements are mapped underneath. This aligns technical insights with business priorities. Dynamic mapping, where relationships and views evolve in real time, is vital for supporting modern DevOps workflows. Organizations should also prioritize use cases during implementation, such as incident response, compliance reporting, or service documentation, to maximize return on investment.
1. Start with Critical Services
Don’t try to map everything at once. Begin with the most business-critical services or those with frequent incidents. This ensures early wins and stakeholder buy-in.
2. Integrate with Your CMDB and Discovery Tools
Avoid standalone mapping tools that don’t integrate with your CMDB. A hybrid CMDB should be your central hub for CI data and visualizations.
3. Enable Real-Time Updates
Stale maps are worse than no maps. Ensure your system supports real-time or near-real-time updates using webhooks, event buses, or agent-based tracking.
4. Use Role-Based Views
Different teams need different levels of detail. Make sure your visualization tools support customized views for developers, operators, auditors, and executives.
5. Govern CI Relationships
Use validation rules and reconciliation workflows to ensure mapped relationships remain accurate. This includes flagging:
- Duplicate or orphaned nodes
- Inconsistent metadata
- Mismatched system identifiers
6. Measure and Iterate
Track usage of dependency maps and gather feedback from teams. Are they helping reduce MTTR? Are they making better decisions? Use this input to evolve your mapping strategy.
Challenges and Considerations
While visual dependency mapping is powerful, it’s not without challenges:
- Data overload: Excessive detail can overwhelm users; therefore, filtering is essential.
- Cross-platform normalization: Unifying data from cloud, on-prem, and containers requires smart correlation logic.
- Tool sprawl: The use of multiple tools to collect similar data can create redundancy or inconsistency.
- Security and access control: Sensitive architecture diagrams must be secured and access-controlled.
A successful implementation requires coordination across ITSM, DevOps, cloud, and security teams.
The Future of Visual Mapping in Hybrid CMDBs
As environments grow more dynamic, visual dependency mapping will become even more essential. Emerging trends include:
- AI-assisted mapping: Using machine learning to infer relationships or detect anomalies
- Self-healing systems: Triggering automated remediation workflows based on map changes
- Digital twin modeling: Building live simulations of your IT infrastructure using dependency data
- Cross-domain federation: Mapping dependencies across multiple CMDBs or domains (e.g., IT + OT)
In the future, dependency mapping won’t just be a visualization layer; it will be the foundation for autonomous IT operations.
Closing Notes
In a hybrid, multi-cloud world, the complexity of understanding how IT systems connect has never been greater. Visual dependency mapping, when integrated into a modern hybrid CMDB, addresses this challenge by transforming raw configuration data into intuitive, actionable maps.
It enhances IT visibility, speeds up root cause analysis, informs change planning, supports compliance, and aligns with modern practices like DevOps and SRE. As environments evolve, this capability will shift from a helpful add-on to a mission-critical feature of any scalable IT management strategy.
Organizations that incorporate visual mapping into their CMDBs position themselves to operate more confidently, recover from failures more quickly, and plan more intelligently. It’s not just about seeing what’s there; it’s about understanding how it all works together.


.webp)
.png)


.webp)