Ticketing Analytics Dashboard

Ticketing Analytics Dashboard
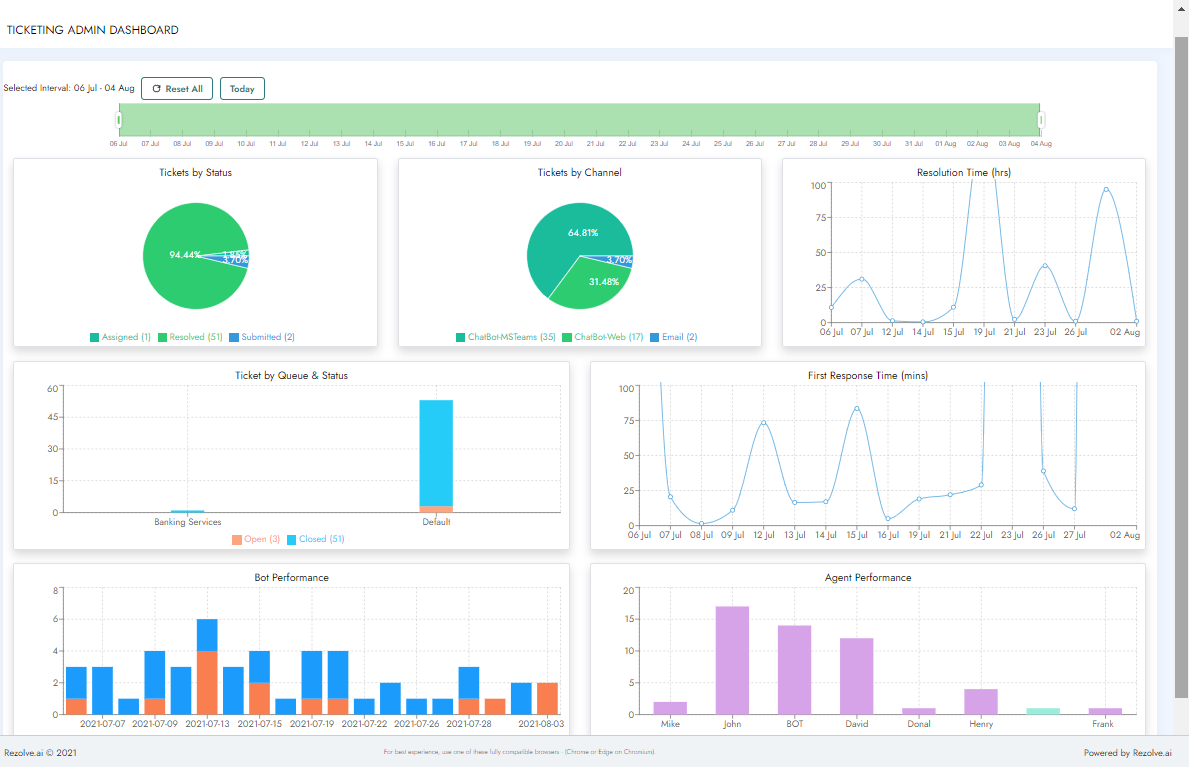
The Ticketing Analytics Dashboard provides several insightful analytics. The Dashboard has the ability to show real-time data. Dashboard widgets help you to easily understand ticketing activities and enable you to monitor the performance of your helpdesk.
Role Required:
Ticket Agent Supervisor
Features
1. Cross Filter & Dynamic Charts
No need to select filter criteria in traditional way, just click on the interactive charts to filter the data i.e: Just click on Channel pie chart to filter data based on specific channel.

2.Data on mouse hover

Ticket by Status & Channel:
- Ticket volume by Status.
- Ticket Volume by Channel.
- Work as cross filter.

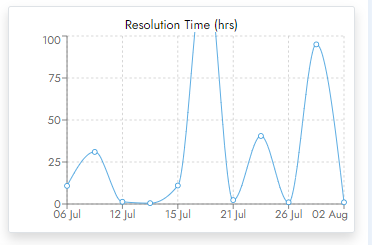
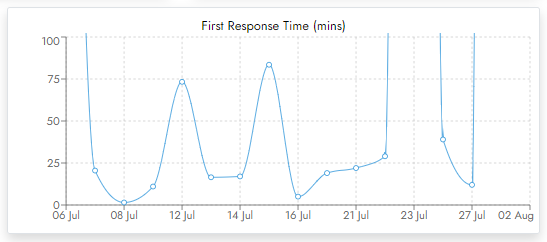
Resolution & First Response Time
- These graph view help admin to evaluate the efficiency of your agents.
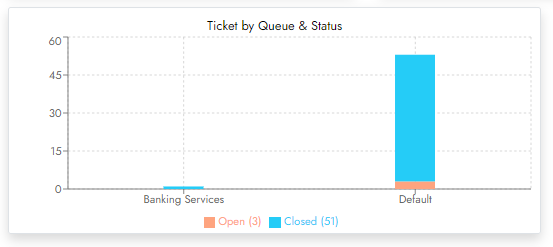
Ticket by Queue & Status
- Ticket volume by Queue
- Open & Close volume for each queue.
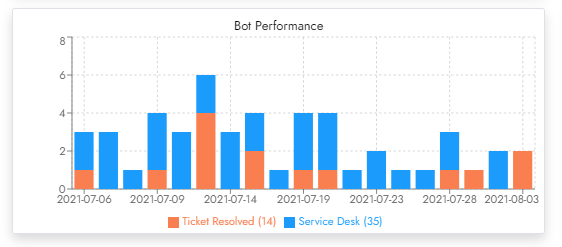
Bot Performace
- Ticket Auto Resolved by bot
- Ticket Escalated by bot
Agent Performace
- Ticket volume done by agent
- Ticket volume pending with agent

Rezolve.ai is an enterprise Agentic AI solution that deploys specialist AI agents for IT and shared services to reduce cost, accelerate resolution, and elevate employee experience.